Inside the Heart of a Star: Simulating Stellar Evolution with MESA
Introduction
Have you ever looked up at the night sky and wondered what a star truly is? Stars are dynamic, living entities, constantly changing and evolving over vast stretches of time. Understanding them helps us understand our place in the universe.
This article takes you on a journey inside a star, exploring the processes that drive its life cycle, and how scientists model these distant giants using MESA (Modules for Experiments in Stellar Astrophysics). Theoretical background is based on Prialnik’s Stellar Structure and Evolution [1].
What Defines a Star?
A star is:
- A massive collection of gas, held together by its own gravity.
- A luminous object radiating energy from nuclear fusion in its core.
A star’s life is governed by these two conditions. Its death occurs when gravity overwhelms pressure (collapse) or when it runs out of fuel (fading away).
Key Concepts in Stellar Evolution
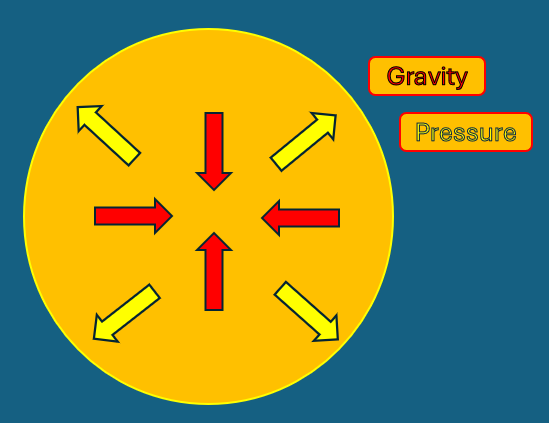
Hydrostatic Equilibrium
A star is in hydrostatic equilibrium when gravity pulling inward is balanced by pressure pushing outward:
\[\frac{dP}{dr} = -\frac{Gm\rho}{r^2}\]This means pressure must increase toward the core to counteract gravity.
Energy Generation and Transport
Stars shine due to nuclear fusion in their cores. The energy equation:
\[\dot{u} + P \cdot \dot{\left(\frac{1}{\rho}\right)} = q - \frac{\partial F}{\partial m}\]where $u$ is internal energy, $q$ is nuclear energy generation, $F$ is energy flux.
Spherical Symmetry
Stars are nearly spherical due to gravity. The mass-radius relation:
\[dm = \rho 4\pi r^2 dr\] 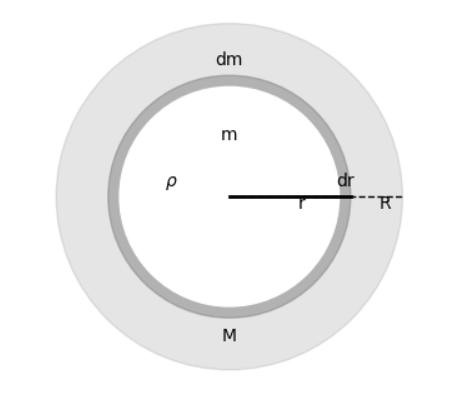
Nuclear Reactions and Composition
Nuclear reactions change the composition of a star’s core, governed by conservation of charge, baryon number, and lepton number. The rate of change of mass fraction $X_i$ is:
\[\dot{X}_i = f(\rho, T, X)\]When $\dot{X}=0$, the star is in nuclear equilibrium.
Modeling Stars: The MESA Code
Because we can’t observe stellar interiors directly, scientists use computer models. MESA is a powerful, open-source 1D stellar evolution code [2]. It solves the equations of stellar structure and evolution, given initial conditions and physics modules.
Installation: MESA runs on Linux/macOS. For Windows, use WSL. Installation can be time-consuming but is well-documented [2].
How MESA Works: Simulations are controlled by an inlist file (parameters, stopping conditions) and a pgstar_inlist file (for plots). MESA reads these and simulates the star’s evolution.
My Simulation: A Sun-like Star
I modeled a 1 $M_\odot$ (solar mass) star from pre-main sequence to the red giant phase using MESA v24.08.1. The HR (Hertzsprung-Russell) diagram below shows the star’s evolutionary track:


Interpreting the HR Diagram
- Pre-Main Sequence: Track starts at low temperature and luminosity (right side).
- Main Sequence: Nearly horizontal phase (stable hydrogen burning).
- Subgiant/Red Giant: Sharp upward turn (luminosity increases, temperature drops).
- Red Giant Branch: Envelope expands, luminosity increases, temperature drops further.
Connecting Theory and Simulation
Reading theory helped me interpret simulation outputs—core temperature, luminosity, radius, and evolutionary phases. MESA turned from a black box into a meaningful tool, letting me see how small changes in mass or composition affect a star’s life.
Why This Matters
Stellar evolution is an active research area. Challenges include modeling mixing, mass loss, rotation, magnetic fields, and binary interactions. New observations (Gaia, TESS, JWST) reveal unexpected behaviors, prompting model refinements. MESA is continuously updated to keep pace with discoveries.
References
- Prialnik, D. (2009). An Introduction to the Theory of Stellar Structure and Evolution, 2nd ed., Cambridge University Press.
- Paxton, B. et al. (2011). MESA Paper, DOI
- Mishra, A. (2025), Zenodo Record
Figures and simulation data generated by the author using MESA v24.08.1. For full simulation files, see Zenodo Record 15571157.